The linear relationship defined by the CAPM between the cost of capital and a share's beta was first called into question when analyzing historical stock returns which revealed that companies smaller than the index-weighted average post higher returns not accounted for by their beta.
In practice, more than 80% of European and North American companies have capitalizations below the regional index average and are potentially concerned by the size premium .
We calculate the size premium from the implied cost of capital for each of the companies in the sample by grouping them into 11 quantiles ranked according to market capitalization in order to constitute sufficiently diversified portfolios.
The size premium of any european company with a capitalization of less than €7.9bn is calculated according to the following function:
The size premium for any North American company of less than $1bn is calculated as follows:
In Europe, neutralizing systematic risk accentuates the size effect and extends it to nine quantiles out of 11, i.e. for companies with up to a €7.9bn capitalization.
For North American companies, the size effect is also evident before neutralizing systematic risk. However, since the beta of the first 10 quantiles is greater than 1, correction reduces the size effect. After adjusting the quantile betas the size premium tends to disappear at the 4th quantile, i.e. above market caps of $1bn.

Highlighting the size effect
The linear relationship defined by the CAPM between the cost of capital and a share's beta was first called into question when analyzing historical stock returns. This analysis revealed that companies which are smaller than the index-weighted average post higher returns not accounted for by their beta. When we calculate the implied cost of capital and the ex-ante risk premium, we confirm this result by retaining market expectations instead of past price fluctuations.
As indicated in methodological note 3, the gap between the implied market premium,
ΠE , and the risk premium within the strict meaning of the CAPM,
ΠR, consists of additional premia for forecast biases: the default risk premium,
Πd, and the premium for excessive optimism,
ΠO. As these forecast biases are more pronounced for small caps, the sum of
Πd and
ΠO for these companies is larger, and the spread vs large caps can be aggregated into a
size premium,
ΠL. It is likely that only a small part of this difference stems from a liquidity effect that reflects: (i) the partially fixed nature of transaction costs which weigh on the returns of smaller sized investments; and (ii) the narrower scope for small caps transactions, since their order books have less absorption capacity.
The market risk premium (or the index proxy risk premium) is an average, weighted by the companies' market capitalizations. In practice, more than 80% of European and North American companies have capitalizations below the regional index average we have calculated. The size premium thus potentially concerns most companies.
Calculating the size premium
We calculate the size premium from the implied cost of capital for each of the companies in the sample by grouping them into 11 quantiles ranked according to market capitalization in order to constitute sufficiently diversified portfolios
[1] :
- Individual company returns are established excluding debt, i.e. we calculate an unlevered cost of capital for each company, or kU;
- For each quantile we take into account: (i) the unlevered cost of capital with zero debt equal to the arithmetic mean of the companies in this quantile; and (ii) a beta for this quantile's portfolio[2]. This data makes it possible to strip systematic risk[3], and the leverage effect from the size effect. This is what we call the "neutralization of systematic risk" or "correction of the quantile beta";
- Finally, quantile size premiums are regressed to their average capitalization to smooth the results, (see below).
The size premium in Europe at the end of 2016
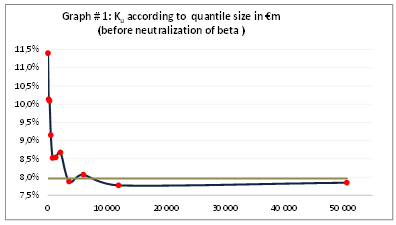
As of December 31, 2016, the average capitalization of the 11 quantiles was between €36m (1st portfolio) and €51bn (11th portfolio). As shown in Chart 1, before we neutralize systematic risk, the implied cost of equity for the 11 portfolios follows a decreasing function of size (market capitalization) of the logarithmic type or the inverse function type. Compared to the weighted average cost of capital for our European sample, the first seven quantiles have a significantly higher than the index (i.e. the weighted average of our entire European sample). The first seven quantiles encompass 63.6% of companies ranked by increasing size, up to a capitalization of €2.7bn.
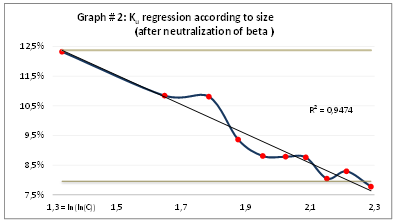
As shown in Chart 2, after we neutralize systematic risk, the first nine quantiles have above-index returns. This represents 92% of the companies with a capitalization of less than €7.9bn.
As the size effect disappears at the 10th quantile, we adjust the first 10 portfolios by using the regression technique to smooth this effect. The return's regression with respect to the double logarithm of size as shown in Graph 2 gives a coefficient of determination r² of 95% (equation below).
On the basis of this regression, the size premium of any company with a capitalization of less than €7.9bn is calculated according to the following function:
Where C is the market capitalization of the assessed company.
The regression parameters are summarized in the table below:
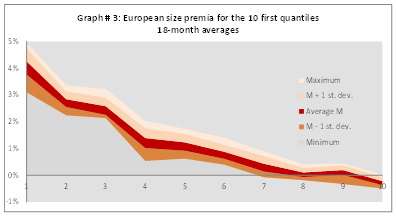
The non-smoothed averages over 18 months (upper boundary of the area in red) and the dispersion indicators for quantile size premia are shown in Graph 3, which confirms the persistence of a size premium up to the 7th quantile, i.e. up to €2.7bn in capitalization. Variations from one month to the next can lead to the disappearance of the premium from the 7th quantile and its existence up to the 9th.
The size premium in North America at the end of 2016
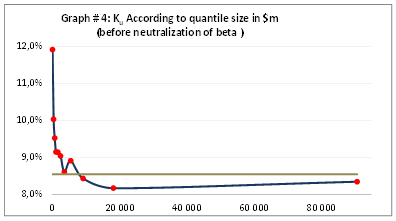
As of December 31, 2016, the average capitalization of the 11 quantiles ranged from $160m (first portfolio) to $91bn (11th portfolio). As suggested in chart 4, before we neutralize systematic risk, the implied cost of equity of the 11 portfolios follows a decreasing function of market capitalization, as in the Europe sample. The first eight quantiles (72% of companies) thus have a higher required return than the market-weighted index.
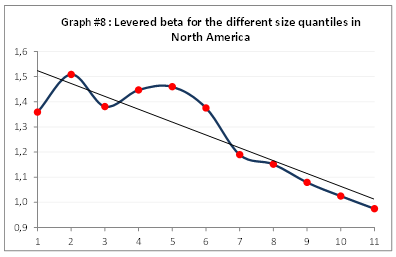
The first nine quantiles have beta values higher than the index (Chart 8), unlike in Europe. Part of the excess required return for small caps is therefore attributable to their systematic risk
[4].
Adjusted for this systematic risk, by the end of 2016, only the first three quantiles still show a required return significantly higher than the index. These three portfolios include companies with a capitalization of less than $1bn, representing 27% of the companies in our index.
By making a second, narrower cut on the basis of 120 companies in each portfolio, the size premium remains for companies with market caps of less than $1bn. Regressing the performance relative to the inverse of the size logarithm as represented in Graph 5 shows a coefficient of determination r² equal to 98% (see the next equation).
The size premium for any company of less than $1bn is calculated as follows:
Where C is the market capitalization of the assessed company.
The regression parameters are summarized in the table below:
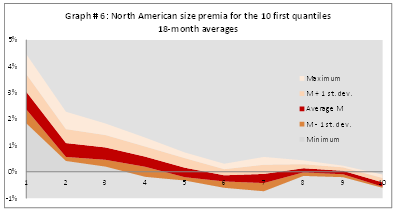
The average (before smoothing) over 18 months and the dispersion indicators for size premia for the first 10 out of 11 quantiles are shown in the graph below, which identifies the existence of a size premium between the 1st and the 4th portfolio (for capitalizations of less than $1bn). We observe that variations from one month to the next could lead to the disappearance of the premium from the 4th quantile and its existence up to the 9th.
Conclusion
In Europe
The size premium in Europe decreases monotonically up to the 8th quantile before smoothing by means of regression. This relationship established on the basis of the unlevered implied cost of capital is confirmed, whether or not the latter is adjusted for the quantile beta.
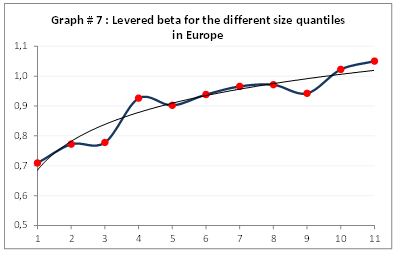
Neutralizing systematic risk accentuates the size effect and extends it to nine quantiles out of 11, i.e. for companies with up to a €7.9bn capitalization. This is because the monthly betas (with leverage) of the 11 portfolios increase, ranging from 0.7 (very small caps) to 1 (very large caps)
[5].
In North America
For North American companies, the size effect is also evident before neutralizing systematic risk. However, since the beta of the first 10 quantiles is greater than 1, correction reduces the size effect, i.e. the part of the required excess return not explained by systematic risk.
After adjusting the quantile betas and re-grouping the companies in our sample into portfolios of 120 stocks each, the size premium tends to disappear at the 4th quantile, i.e. above market caps of $1bn.
Transatlantic differences
The effect of size on the implied cost of capital thus appears to be a more extensive and regular phenomenon in Europe than in North America:
- on average over 18 months, the size premium mainly concerned companies with market caps under $1bn in North America, while in Europe it consistently concerned companies with market caps up to €2.7bn;
- In Europe, from one month to the next, the upper limit of the size premium's domain varies between capitalizations of €2.7bn and €7.9bn. In North America, this limit range is from $1bn to $7bn.
[1] Samples of 1,516 companies in Europe and 1,841 in North America, each divided into 11 quantiles. [2] For each quantile we create an aggregate index with price trends regressed to the general market index. [3] The APV method allows this adjustment. For more details, see note #5. [4] Assuming that the beta we calculate (see note #6, forthcoming) is a satisfactory estimate and assuming that systematic risk as defined by the CAPM is an acceptable model. [5] For more details on beta calculation, please see note 6 (forthcoming).


